
Topographic maps, also known as topo maps, typically display elevation characteristics, natural and structural features as well as hydrography and infrastructure data in a large-scale format. Essentially, topo maps provide a third dimension to an otherwise flat map. Topo maps are used for a range of applications, from geographic research studies to environmental impact assessments for commercial and residential development – and beyond. Understanding how to read the direction of slope and gauging the degree of elevation change can be valuable when analyzing recognized environmental conditions within the vicinity of your target property – potentially allowing you to determine where contaminants are likely to migrate.
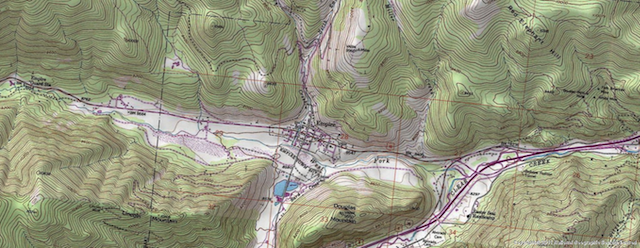
Changes in elevation and slope are displayed on topo maps through the use of “contour lines,” which are lines that represent different altitudes. For areas with little elevation changes, such as prairie lands, contour lines are spaced further apart due to the very gradual elevation change, and the difference between contour lines may represent an elevation change of only 10 feet. In areas where terrain changes elevation drastically, such as the Rocky Mountains (shown on the map above), topo lines will appear closer together and can represent 20 feet of elevation change. In addition to contour lines, topo maps show streams, rivers, lakes, or other significant bodies of water as well as forested areas, developed areas, and even individual buildings of substantial size. In some states, topo maps also show additional location information such as section, township, and range.
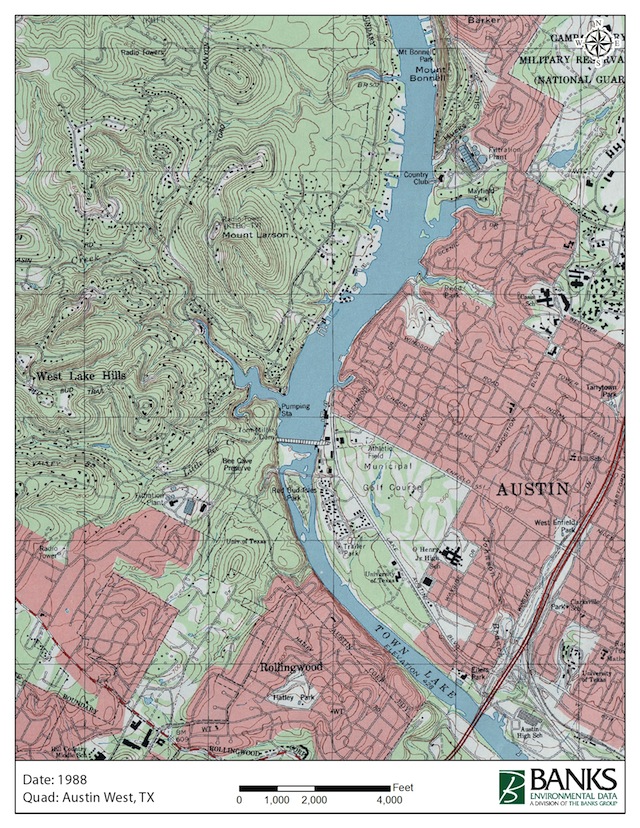
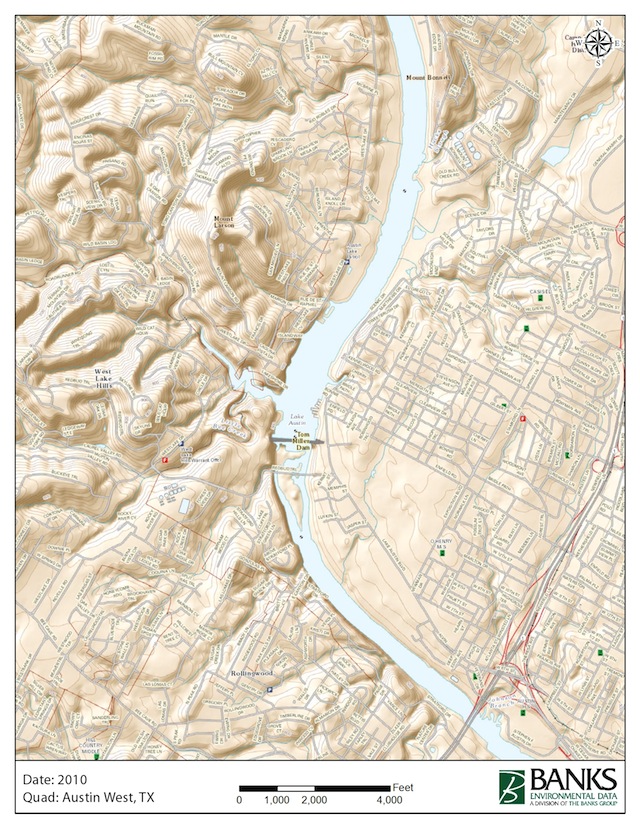
Most topo maps were and continue to be published by the Unites States Geological Survey (USGS). Within the last couple of years the USGS has begun producing new topo maps that show elevation changes using contour lines and also feature shaded relief using digital elevation models (DEM). Although the new maps do not display as many man-made structures as historical topo maps, the new maps represent a more accurate lay of the land and provide more street labels.
Topo map from 1988:
Topo map from 2010:
Although a topo map provides a considerable amount of information by itself, it can prove to be even more valuable as a base layer or background for displaying and comparing other types of data in a geographic information system (GIS). For example, if you are performing a Phase I ESA and investigating a leaking petroleum storage tank near your target property, you may want to assess the slope and gradient surrounding your site to determine where contamination may have traveled and determine if the tank release could have potentially impacted your property. Adding leaking tank data on top of a USGS topo map using GIS provides additional insight by being able to compare multiple features all at once and make precise calculations.
 Until next time,
Adam Marshall
Program Manager – Aerials & Historical Mapping
amarshall@banksinfo.com